Introduction
Cardiac Disease (CD) remains the leading cause of death globally. Advances in biomarker research and developments related to CD over the past 30 years have led to more sensitive screening methods, a greater emphasis on its early detection and diagnosis, and improved treatments resulting in more favorable clinical outcomes in the community [1]. Proteins as biomarkers are useful diagnostic parameters and alteration of their expression can be an early sign of an altered physiology that may be indicative of disease [2]. Thus, plasma is usually a source of biomarker discovery by proteomics analysis. Potential novel disease markers are often present at low concentrations. The most abundant proteins are albumin (HSA) and immunoglobulin G (IgG). HSA constitutes 57-71% and IgG constitutes 8-26% of all plasma proteins [3] that’s why they tend to mask lower abundance proteins which may have a similar isoelectric point or similar molecular weight on gel electrophoresis. [4,5].
Electrophoresis gel consists mainly of two techniques: (1-DE) and (2-DE). 1-DE allows the separation of charged proteins in an electric field according to their molecular weights [6]. 2-DE separates proteins in two steps: the first-dimension (1-D) and the second-dimension (2-D) gel electrophoresis. In 1-D, proteins are separated by their isoelectric point (pI), the pH at which a protein carries no net charge and will not migrate in an electrical field. 1-D gel is also called isoelectric focusing electrophoresis (IEF). [7]. A good sample preparation is the key to successful IEF. In the 2-D, proteins after IEF are further resolved by their molecular weight (MW) using sodium dodecyl sulfate (SDS)-polyacrylamide gel electrophoresis (PAGE). The resulting gel is then stained with silver to visualize the protein spots. Protein patterns on 2-D gels are analyzed using software programs to statistically and scientifically determine meaningful spots.
Materials and Methods
2.1 Reagents and instruments:
All reagents were of the highest available grade. Urea, thiourea, hydrochloric acid (HCl), Iodoacetamide,1,4-Dithiothreitol (DTT), triton X-100,acetone, glycerol, sodium dodecysulfate (SDS), tetra-methyl-ethyl-enediamine (TEMED), ethanol, acetic acid, glutharaldyde, sodium acetate, silver nitrate, sodium hydroxide, ammonium hydroxide, formaldehyde, citric acid, Ethyl-enediamine-tetraacetic acid (EDTA), proteoprep blue albumin and IgG depletion kit, bovine serum albumin (BSA), kit bicinchoninicacid assay (BCA), bromophenol blue (BPB), were purchased from Sigma-Aldrich. Acrylamide, bis-acrylamide, amoniumpersulfate (APS), 3-[(3-chol-amido-propyl) dimethylammonio]-1-propanesulfonatehydrate [CHAPS)], were purchased from (Bio-RAD). Size marker ranging from 31 kDa to 460 kDa (Thermo Scientific). Denaturation buffer containing 62,5 Mm Tris-HCl pH 6.8, 20% v/v glycerol, 2% w/v SDS, 5% β-mercaptoethanol, 1% w/v bromophenol blue. Rehydration buffer containing 7 M urea, 2 M thiourea, 4% w/v CHAPS, 50 mM DTT, 0.2% v/v ampholyte and 0.001% bromophenol blue. Two equilibration buffers: the first one contained 0,375 M of Tris-HCl, pH 8.8, 6M urea, 20% v/v glycerol, 2% w/v SDS, 130 mM DTT and 0.01% w/v BPB. The second one contained the same composition except that DTT was replaced with 135 mM iodoacetamide. For polyacrylamid gel electrophoresis sizes (7.2 cm x 8.6 cm x 1mm) 8%, it contains: (30% (w/v)) acrylamide, 0.8% (w/v) bis-acrylamide, tris-HCl (pH=8,8 ; 1.5M), SDS (10%), TEMED, APS (10%). Immobilized pH gradient (IPG) gel strips with a length of 7 cm with linear pH 3-10,protean IEF cell , GS-800™ calibrated densitometer were purchased from Bio-Rad, Mini PROTEAN tetra cell system, Microplate Spectrophotometer, Quantity One and PD-Quest software were purchased from Bio-RAD. A dry-bath incubator and a Centrifuge (Heraeus) (Thermo Scientific)
2.2 Sample collection
A collection of plasma was performed by blood test. During collection, tubes were used with an EDTA anticoagulant. The tubes were then centrifuged at 3000rpm for 10min at room temperature to separate plasma and blood cells. The collected plasma was stored at -20°C.
2.3 Depletion of high-abundance plasma proteins
Many varied approaches have been developed to remove abundant proteins (HSA) and (IgG) from plasma [8,9,10]. In order to facilitate the isolation and identification of low plasma proteins, a selective column depletion kit "ProteoPrep Blue Albumin and IgG Depletion Kit was used according to the manufacturer´s instructions. Briefly, the provided suspended slurry medium was added to the spin columns, centrifuged and equilibrated at 8000x g for 10s. The spin columns were then collected in fresh collection tubes. To each spin column 0.1mL of plasma sample was added to the packed medium bed, incubated for 10min, centrifuged at 8000x g for 60s. This step was repeated twice to remove additional albumin. The two times depleted plasma remained in the collection tube and was pooled for optimal protein recovery. The albumin/IgG depleted plasma samples were stored at -80°C for long-term storage.
2.4 Protein assay
Total protein content in plasma samples was determined by the BCA kit and BSA were employed. The standard calibration solution BSA (2mg/ml) is diluted successively in PBS so as to obtain the known concentrations and which will be used to calculate a standard curve. The plasma sample is diluted 1/10 in PBS. With 100µl of sample (diluted 1/10) in the presence of 100µl of BCA mixture and cooper reagent (copper sulfate), the mixture is incubated in the dark for 30min at 37°C. After incubation, the plate was read at a wavelength of 560nm using a spectrophotometer. After measuring, the samples are aliquoted and stored at -80°C.
2.5 Protein solubilization
Solubilization must also permit the removal of substances, such as salts, lipids, polysaccharides, and nucleic acids. For the abovementioned reasons, sample solubility is one of the most critical factors for successful protein separation by gel electrophoresis. The most popular method for protein solubilization was described by O’Farrell [11].Other methods also work well but are not universally applicable [12,13]. In our case, we added 400μl of ice-cold acetone to the depleted plasma sample and kept for overnight at -20°C.The sample solution was centrifuged at 15000 g for 10min at 4°C, the supernatant was removed and the pellet was air-dried. The pellet was then suspended in 100μl of lysis buffer as above. For SDS-PAGE, the protein pellet was suspended in 100μl of lysis buffer containing 8M urea, 2.5M thiourea, 40mM Tris- HCl, 3% w/v CHAPS and 0.5% v/v triton X-100. The protein sample was stored frozen at -80°C until analysis.
2.6 One-dimensional SDS gel electrophoresis (1-DE)
First, a volume of sample was dissolved in a denaturant buffer and then was boiled for 5min at a temperature of 100°C in the dry bath. After that, a volume of sample corresponding to 20μg was deposited and separated under reducing conditions on 8% SDS-PAGE mini gels at 40V for 15min and constant currents 60V for 2h and visualized by silver staining according to standard protocols. These gels were scanned on the densitometer and identified by Quantity-one.
2.7 two-dimensional gel electrophoresis (2-DE)
For 2-DE analysis, individual samples (n=8) were repeated at minimum in triplicates.
2.7.1 IEF (1-D)
Protein samples were dissolved in 125μl of rehydration buffer, and then IPG strips were placed in this buffer containing samples in the Protean IEF Cell for 16h in passive rehydration mode. After rehydration, the focusing tray was taken off to remove any proteins not absorbed on the IPG-strip. Isoelectrofocalisation takes place within protean IEF following the Standard procedure: 250V for 20min, rapid ramping to 5000V for 2h, 5000V for 15kVh. The IPG strips were then equilibrated in two equilibrations buffer for 15min by gentle shaking.
2.7.2. Two-dimensional gel electrophoresis (2-D)
The equilibrated IPG strips were slightly rinsed with milli-Q water blotted to remove excess equilibration buffer and then applied to SDS PAGE gels 8% polyacrylamide using the Mini PROTEAN tetra cell system at 40V for 10min followed by 60V for 150min until the dye front had run off the edge of the gel.
2.8 Protein Detection and Visualization
After 2-D, the separated proteins must be visualized at high sensitivity, but there is a need for the detection method to combine the properties of an extended dynamic range, a linear staining response. Silver staining as it is able to detect less than 1 ng of protein (Weiss et al. 2009), has been the method of choice. In sliver staining method, the gels were fixed in 50% v/v ethanol, 50% v/v acetic acid for 1h. The gels were incubated in 5% ethanol, 5% acetic acid overnight. The gels were rinsed with milli-Q water for 1hthen again fixed with 1% v/v glutaraldhyde, 0,5M sodium acetate for 45min. The fixed gels were rinsed with milli-Q water three times for 15min each. The gels were immersed in 1.5% w/v of silver nitrate, 0.2% w/v sodium hydroxide and 1.3% v/v ammonium hydroxide for 1min and rinsed with milli-Q water three times for 5min each. It was developed with 0.1%formaldehyde and 0.01% w/v citric acid. Finally, the reaction was terminated with 2% v/v acetic acid. The stained gels were scanned using a densitometer for analysis. Then the presence or absence and the value of each protein spot was assessed by PD-Quest and Quantity One.
Results
3.1 Optimization of migration voltage
The protocol in our lab usually allows only a poor migration. To optimize the migration of the proteins, we changed the voltage. Since the initially applied current was very high, we decreased the current from 80V to 40V and from 120V to 60V. This resulted allows a good separation of proteins (figure 1). For IEF, we have minimized the time of rehydration buffer from 16h to 12h at 20°C under a current of 50V (in-gel active rehydration) and also optimized the voltage of IEF using the following parameters compared to the standard procedure: first optimization: 250V for 45min (slow ramping), 1000V for 20min, linear ramping 4000V for 2h and a constant of 4000V until approximately 12kVh were reached; Second optimization: 250V for 15min, 4000V for 2h linear ramping, 4000V for 12kVh.
3.2 Depletion of human plasma sample
IgG and HSA are highly abundant proteins in plasma and they can mask other low-abundant proteins and may cause loss of resolution in gel. Therefore, removal of these proteins facilitates the characterization of plasma proteomes. By using Proteoprep blue albumin and IgG depletion kit, we were able to confirm that the albumin band, at approximately 64kDa and the IgG bands, at approximately 50kDa and 25kDa corresponding to heavy and light chains of IgG respectively, had been effectively removed. This dye-based depletion of human plasma clearly showed that removal of two high abundance proteins lead to the appearance of several proteins that were not detectable in the non-depleted plasma samples. (figure 2).
3.3 Optimization of sample dilutions
The plasma is a tissue rich in proteins. For this reason we produced different dilutions to have the best separation and the best sharpness of the bands. In figure 2 gels containing depleted and undiluted plasma and depleted plasma diluted 1/5, 1/10 and 1/20 are presented. After migration and revealing of the proteins, it has been found that the undiluted depleted plasma strips are sharper and clearer than diluted plasma bands. Accordingly, the numbers of bands in the undiluted depleted plasma are well higher than the bands in the diluted depleted plasma wells (figure 3).
3.4 Optimization of gel porosity
For a better migration of proteins in our samples, the optimization was made with the separation gels of 10% and 8%. The best migration optimization of the majority of medium and high molecular weight proteins has been well distinguished at the 8% gel level (figure 4).
3.5 Optimization of protein precipitation methods
Interference with 1-D precipitation is generally employed to concentrate, select, and separate proteins in the sample from the contaminating species in order to determine the effect of precipitation on depleted human plasma proteins. We compared the effects of different precipitation times with acetone solvent. For this purpose plasma was mixed with ice-cold acetone at 1:4 v/v ratios and precipitated at -20°C for 30min, one hours and two hours. Acetone precipitation resulted in loss of protein as assessed by 1-DE (figure 5). On the contrary, protein recovery was markedly better with the depleted plasma procedure than without precipitation. However, precipitation is prone to protein loss due to poor precipitation or incomplete resolubilisation.
3.6 Optimization of rehydration type and parameters for better separation and migration conditions of IEF
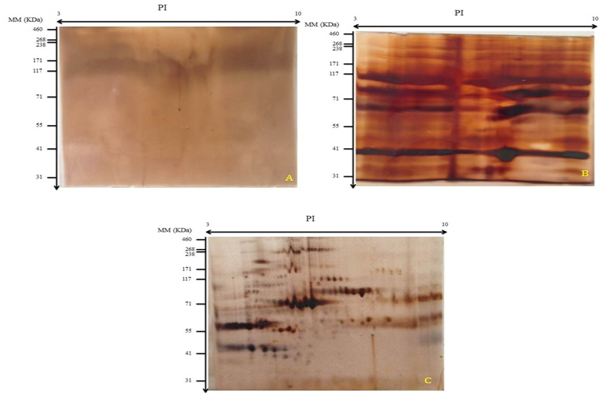
Active rehydration is indicated after 2-DE migration and staining, absence of protein spots (figure 6, gel A). Subsequently, active rehydration was modified by passive rehydration while maintaining the same focusing program. After migration on the SDS-PAGE gel and staining, poorly separated proteins were obtained. We found a mirage of spots (lines) (figure 6, gel B). To do this, passive rehydration was retained and the migration phases were modified. Consequently, a good separation of the protein spots and a very good quality of the 2-DE gel were obtained (figure 6, gel C). Passive rehydration was adequate for our samples.
Figure 1 Effect of migration voltage A: 80V for 15 minand 120V for 1h15 min B: 40V for 15min and 60V for 2h
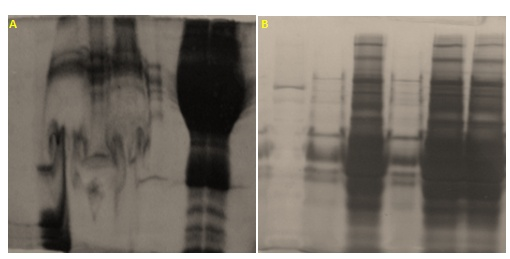
Figure 2 Lane1: Molecular weight marker; Lane 2: Undepleted human plasma; Lane 3: depletedhuman plasma
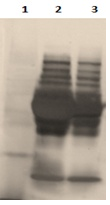
Figure 3 Effect of dilution on depleted plasma. Lane 1: molecular weight; lane 2: dilution 1/5;lane 3 dilution 1/10; lane 4: dilution 1/20; lane 5: depleted plasma without dilution
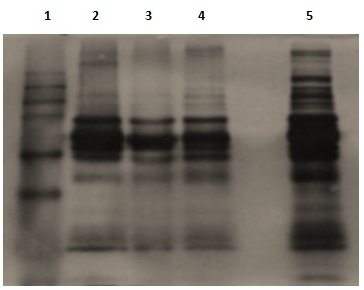
Figure 4 Effect of running gel porosity C: 10% D: 8%
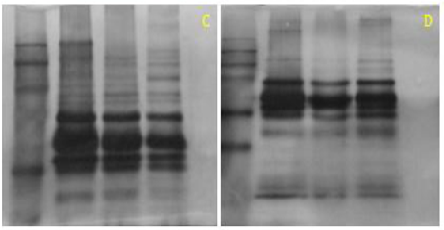
Figure 5 Effect of different precipitation time of human plasma proteins. Lane 4: Molecular weight marker; Lane 5: precipitation 30min; Lane 6: precipitation 1h; Lane 7:precipitation 2h
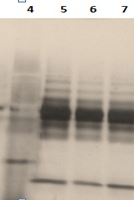
Figure 6 Effect of different rehydratation and concentration of protein. A: gel-2D active rehydration; B: gel 2D passive rehydration; C: Passive rehydration with adequate migration parameter
Discussion
Biomarkers are biological characteristics that are objectively measured and evaluated as indicators of normal biological processes, pathogenic processes or pharmacological responses to a therapeutic intervention [14]. The discovery of new candidate biomarkers is a growing challenge in the biomedical field, both for the development of new drugs and for the clinical management of patients [15]. This discovery requires access to a relative quantification (between healthy and pathological samples) of as many proteins as possible in the study matrix, in order to discover potential candidates and then identify them. The first tool developed to establish and compare protein profiles with combination between 1-DE and 2-DE. This combination exhibit attractive characteristic for use in biomarker discovery phases. Indeed, its sensitivity lies near the nanogram of protein on the gel and it carries the ability to analyze complex samples of various origins. Nevertheless, identifying and validating such molecules as pathophysiological indicators is a long and delicate task, requiring other adapted tools. 1-DE and 2-DE has been successfully applied to identify new biomarker candidates, especially for myocardial infarction [16], various cancers [17,18], hepatitis C [19], Alzheimer's disease [20], or bacterial meningitis [21].
In this study, we have developed optimized methods for analysis of proteomic human plasma (1-DE; 2-DE) for the identification of cardiac protein biomarkers to facilitate the diagnosis of CD. Removal of highly abundant proteins using an albumin and IgG removal kit, gave a better result and a better sharpness of gels and fold increase in relative protein concentration of medium and low abundance proteins. Acetone precipitation is prone to protein loss. So, the best results were achieved with the plasma depleted and without precipitation and dilution for searching new cardiac biomarkers. Passive rehydration with optimized migration parameters turned out to be the optimal procedure according to our study.
Conclusion
Our study shows that improved 1-DE and 2-DE increase the likelihood of discovering new biomarkers of high sensitivity and specificity that can be used as new diagnostic and therapeutic signatures of CD. Though this technique facilitates the detection and identification of new protein biomarkers, the results should be confirmed by mass spectrometry to complete the analysis. 1, 2, 3, 4, 5, 6, 7, 8, 9, 10, 11, 12, 13, 14, 15, 16, 17, 18, 19, 20, 21
References
- An approach to remove albumin for the proteomic analysis of low abundance biomarkers in human serum Ahmed Nuzhat, Barker Gillian, Oliva Karen, Garfin David, Talmadge Kenneth, Georgiou Harry, Quinn Michael, Rice Greg. PROTEOMICS.2003;3(10):1980-1987.
- Proteome analysis and its impact on the discovery of serological tumor markers Poon Terence C.W, Johnson Philip J. Clinica Chimica Acta.2001;313(1-2):231-239.
- A physicochemical study of protein G, a molecule with unique immunoglobulin G-binding properties Akerström B, Björck L. Journal of Biological Chemistry.1986;261:10240-10247.
- Enrichment methods for revealing lower molecular weight biomarkers in human breast plasma proteome Bechr Hamrita African Journal of Biochemistry Research.2012;6(1):1-7.
- A Proteomic Approach for the Diagnosis of Bacterial Meningitis Jesse Sarah, Steinacker Petra, Lehnert Stefan, Sdzuj Martin, Cepek Lukas, Tumani Hayrettin, Jahn Olaf, Schmidt Holger, Otto Markus. PLoS ONE.2010;5(4):e10079-e10079.
- The Human Plasma Proteome: History, Character, and Diagnostic Prospects: Fig. 3. Anderson N. Leigh, Anderson Norman G.. Molecular & Cellular Proteomics.2003;2(1):50-50.
- Proteomic analysis of plasma samples from patients with acute myocardial infarction identifies haptoglobin as a potential prognostic biomarker Haas Benjamin, Serchi Tommaso, Wagner Daniel R., Gilson Georges, Planchon Sebastien, Renaut Jenny, Hoffmann Lucien, Bohn Torsten, Devaux Yvan. Journal of Proteomics.2011;75(1):229-236.
- Novel biomarkers predict liver fibrosis in hepatitis C patients: alpha 2 macroglobulin, vitamin D binding protein and apolipoprotein AI Ho A S, Cheng C, Lee S C. J. Biomed.2010;17:58-58.
- Identification of Clinically Relevant Protein Targets in Prostate Cancer with 2D-DIGE Coupled Mass Spectrometry and Systems Biology Network Platform Ummanni Ramesh, Mundt Frederike, Pospisil Heike, Venz Simone, Scharf Christian, Barett Christine, Fälth Maria, Köllermann Jens, Walther Reinhard, Schlomm Thorsten, Sauter Guido, Bokemeyer Carsten, Sültmann Holger, Schuppert A., Brümmendorf Tim H., Balabanov Stefan. PLoS ONE.2011;6(2):e16833-e16833.
- Accelerating the development of biomarkers for drug safety: workshop summary Giffin R, Robinson S, Olson S. National Academies Press; 2009.
- A review on 2D gel electrophoresis: a protein identification technique Dudhe P S, Kshirsagar Dmm, Yerlekar A S. Int J Comput Sci Inf Technol.2014;5:856-62.
- Plasma proteome analysis: 2D geld and chips Herosimczyk A, Dejeans N, Sayd T, Ozgo M, Skrzypczak W F, Mazur A. J Physiol Pharmacol.2006;57:81-81.
- Cleavage of Structural Proteins during the Assembly of the Head of Bacteriophage T4 LAEMMLI U. K.. Nature.1970;227(5259):680-685.
- Comparison of different depletion strategies for improved resolution in proteomic analysis of human serum samples Björhall Karin, Miliotis Tasso, Davidsson Pia. PROTEOMICS.2005;5(1):307-317.
- High resolution two-dimensional electrophoresis of proteins O'farrell P H. J Biol Chem.1975;250:4007-4028.
- Applying random forests to identify biomarker panels in serum 2D-DIGE data for the detection and staging of prostate cancer Fan Y, Murphy T B, Byrne J C. J. Proteome.2011;10:1361-73.
- ACC/AHA guideline on the assessment of cardiovascular risk: a report of the American College of Cardiology/American Heart Association Task Force on Practice Guidelines Goff D C, Lloyd-Jones D M, Bennett G, Coady S, Agostino D, Gibbons R B, Robinson R, J G. J Am Coll Cardiol.2013;63(25):2935-59.
- High-Abundance Polypeptides of the Human Plasma Proteome Comprising the Top 4 Logs of Polypeptide Abundance Hortin Glen L, Sviridov Denis, Anderson N Leigh. Clinical Chemistry.2008;54(10):1608-1616.
- Biomarkers in drug discovery and development Bakhtiar Ray. Journal of Pharmacological and Toxicological Methods.2008;57(2):85-91.
- Identification and validation of novel cerebrospinal fluid biomarkers for staging early Alzheimer's disease Perrin R J, Craig-Schapiro R, Malone J P. PLoS One.2011;6:16032-16032.
- An effective method for the analysis of human plasma proteome using two-dimensional gel electrophoresis Narenda Yasmin A, S. J Proteomics Bioinformatics.2009;2:495-504.